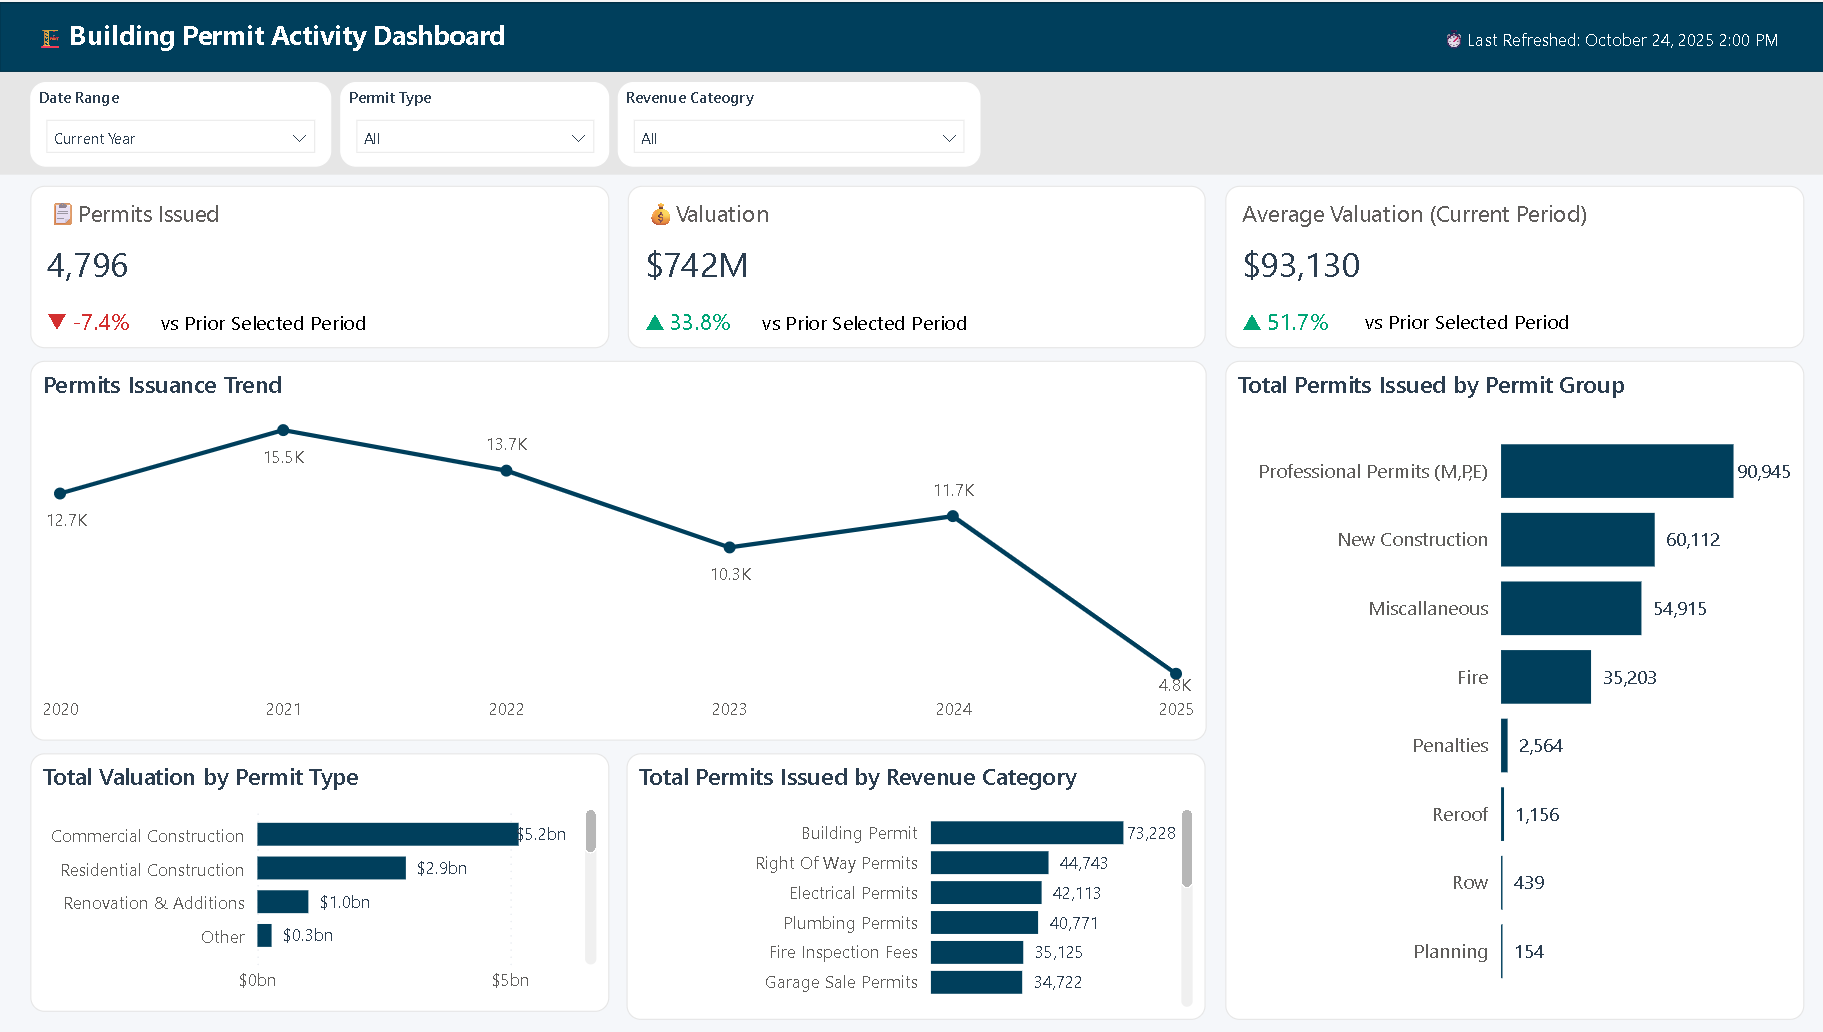
A comprehensive Power BI analytics solution designed to analyze municipal building permit patterns and project valuations across multiple dimensions.
Project Overview
This interactive dashboard transforms raw permit data spanning from 2008 to the present into insights and enables rapid identification of trends and patterns in building activity.
Key Features:
- ✓ IBCS-Inspired Design with Modern Aesthetic
- ✓ Dynamic Time Intelligence with Comparative Analysis
- ✓ Multi-Dimensional Analysis with Cross-Filtering
Technical Implementation:
- Data modeling with proper date table and relationships for optimal time intelligence
- Advanced DAX measures for dynamic filtering, comparative analysis, and variance calculations
- Custom Power BI theme (JSON) ensuring consistent branding and IBCS compliance
Tools & Technologies:
Power BI Desktop | DAX | Power Query | Data Modeling | IBCS Standards | UI/UX Design
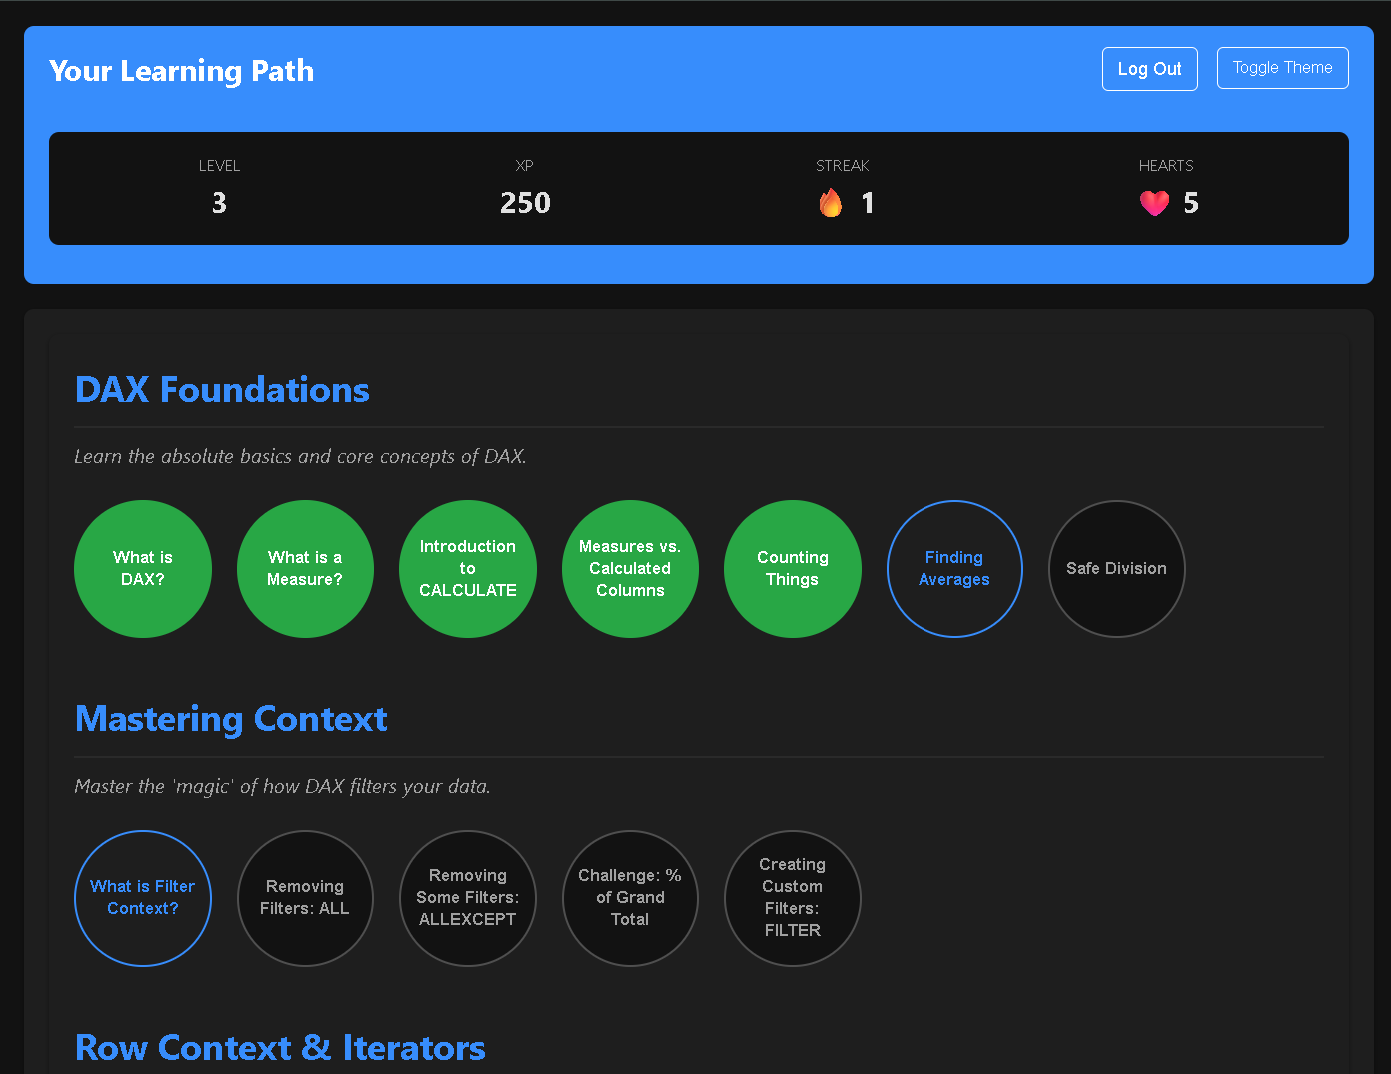
A web app to make learning DAX (Data Analysis Expressions) fun. It has interactive "build-a-function" logic puzzles, real-time feedback, and a gamification engine (XP, Streaks, Levels). Built with JavaScript and Firebase for secure authentication and cloud progress syncing.
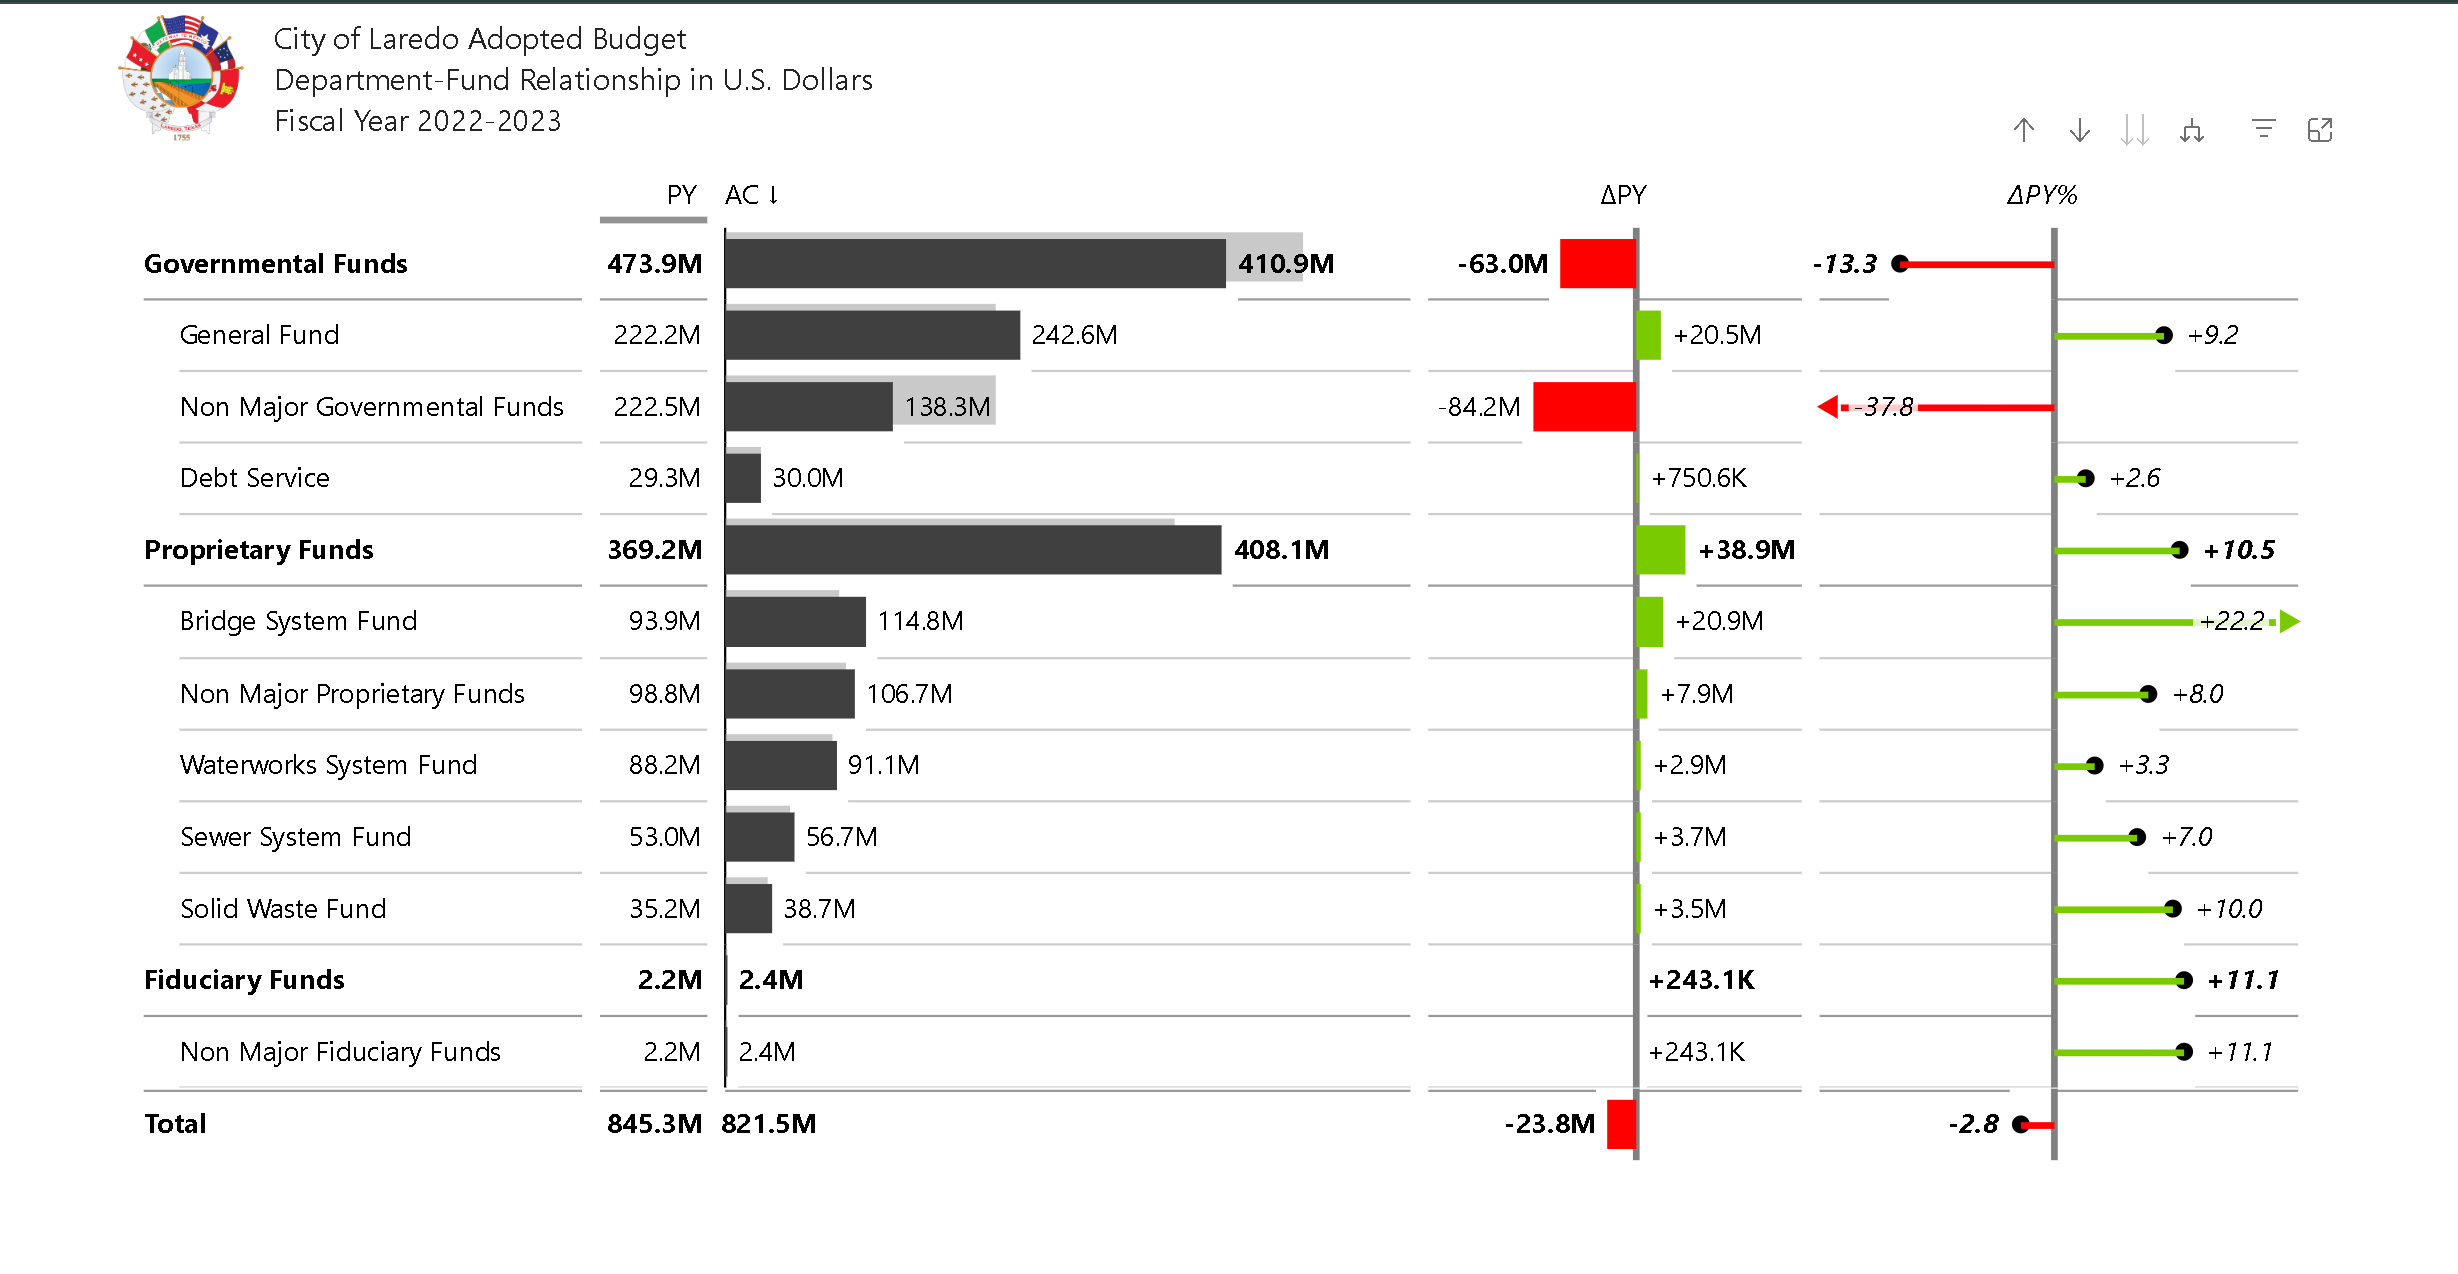
A public-facing interactive Power BI app developed to provide a transparent and comprehensive view of the city's annual budget. Users can explore revenues, expenditures, department-fund relationships, and budgeted positions.
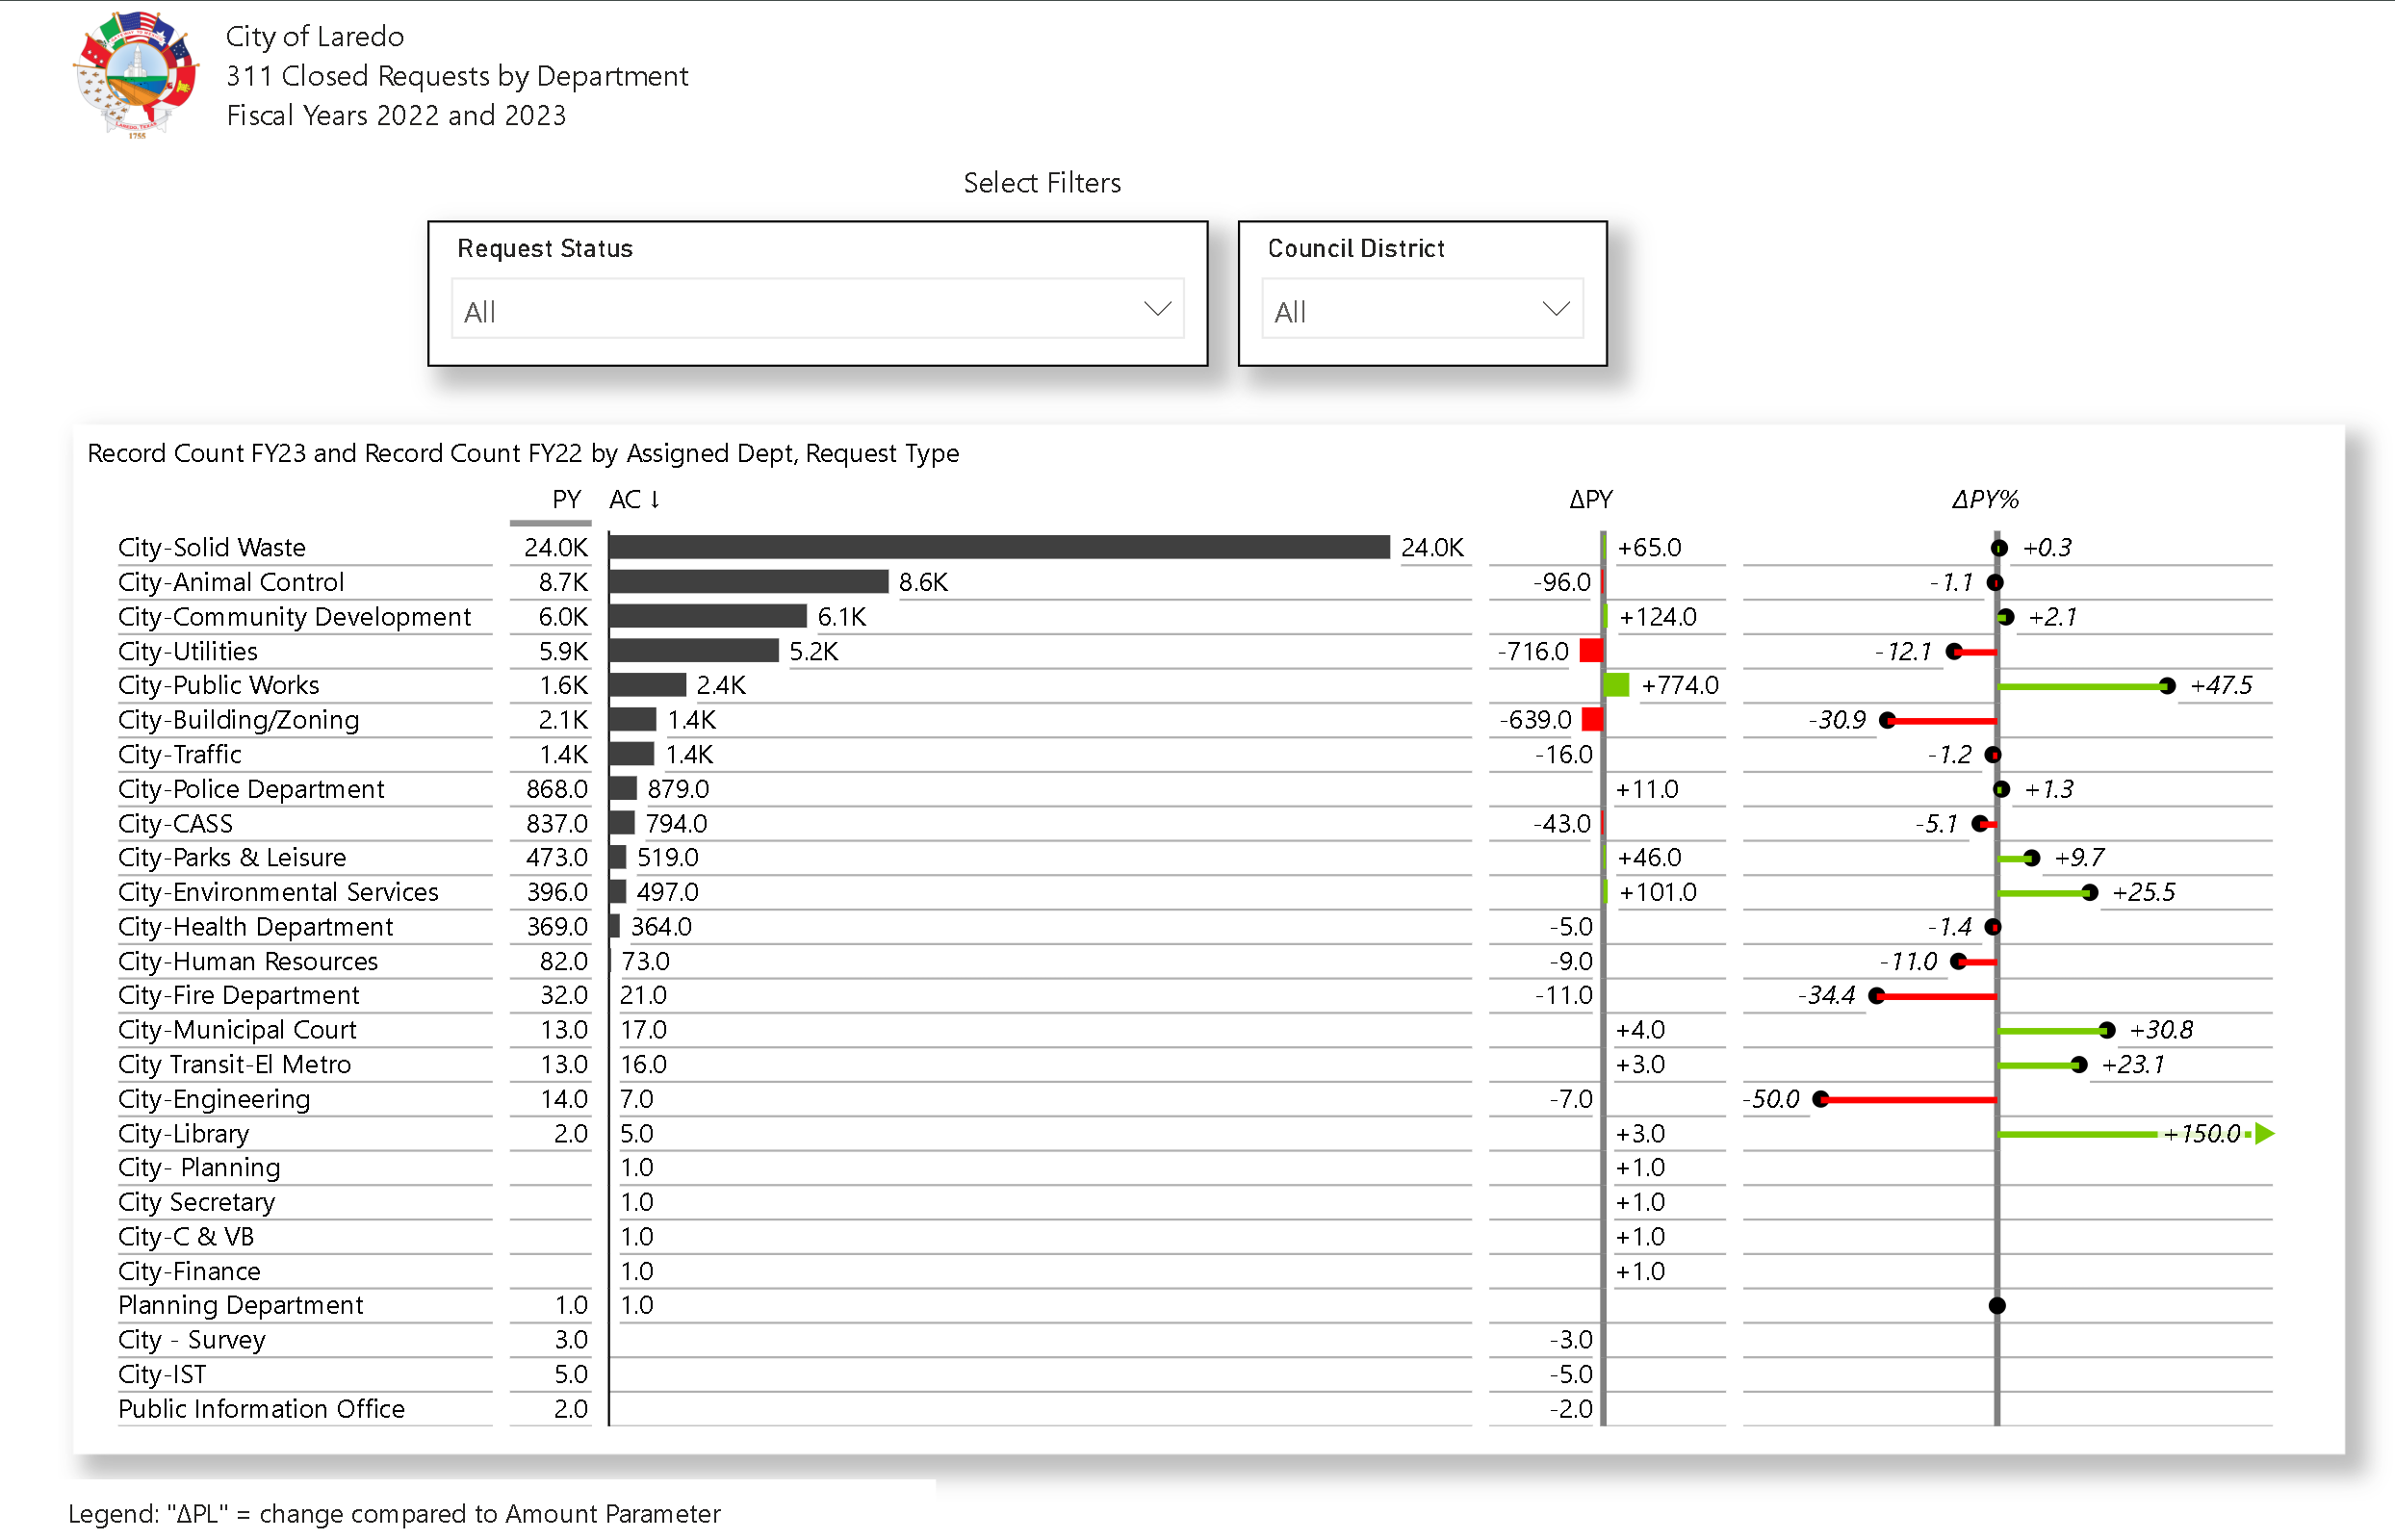
A public-facing dashboard developed to provide the residents of Laredo
with transparent, interactive data on 311 service requests. The project's
goal was to allow users to easily explore requests by assigned department,
request type, and council district.
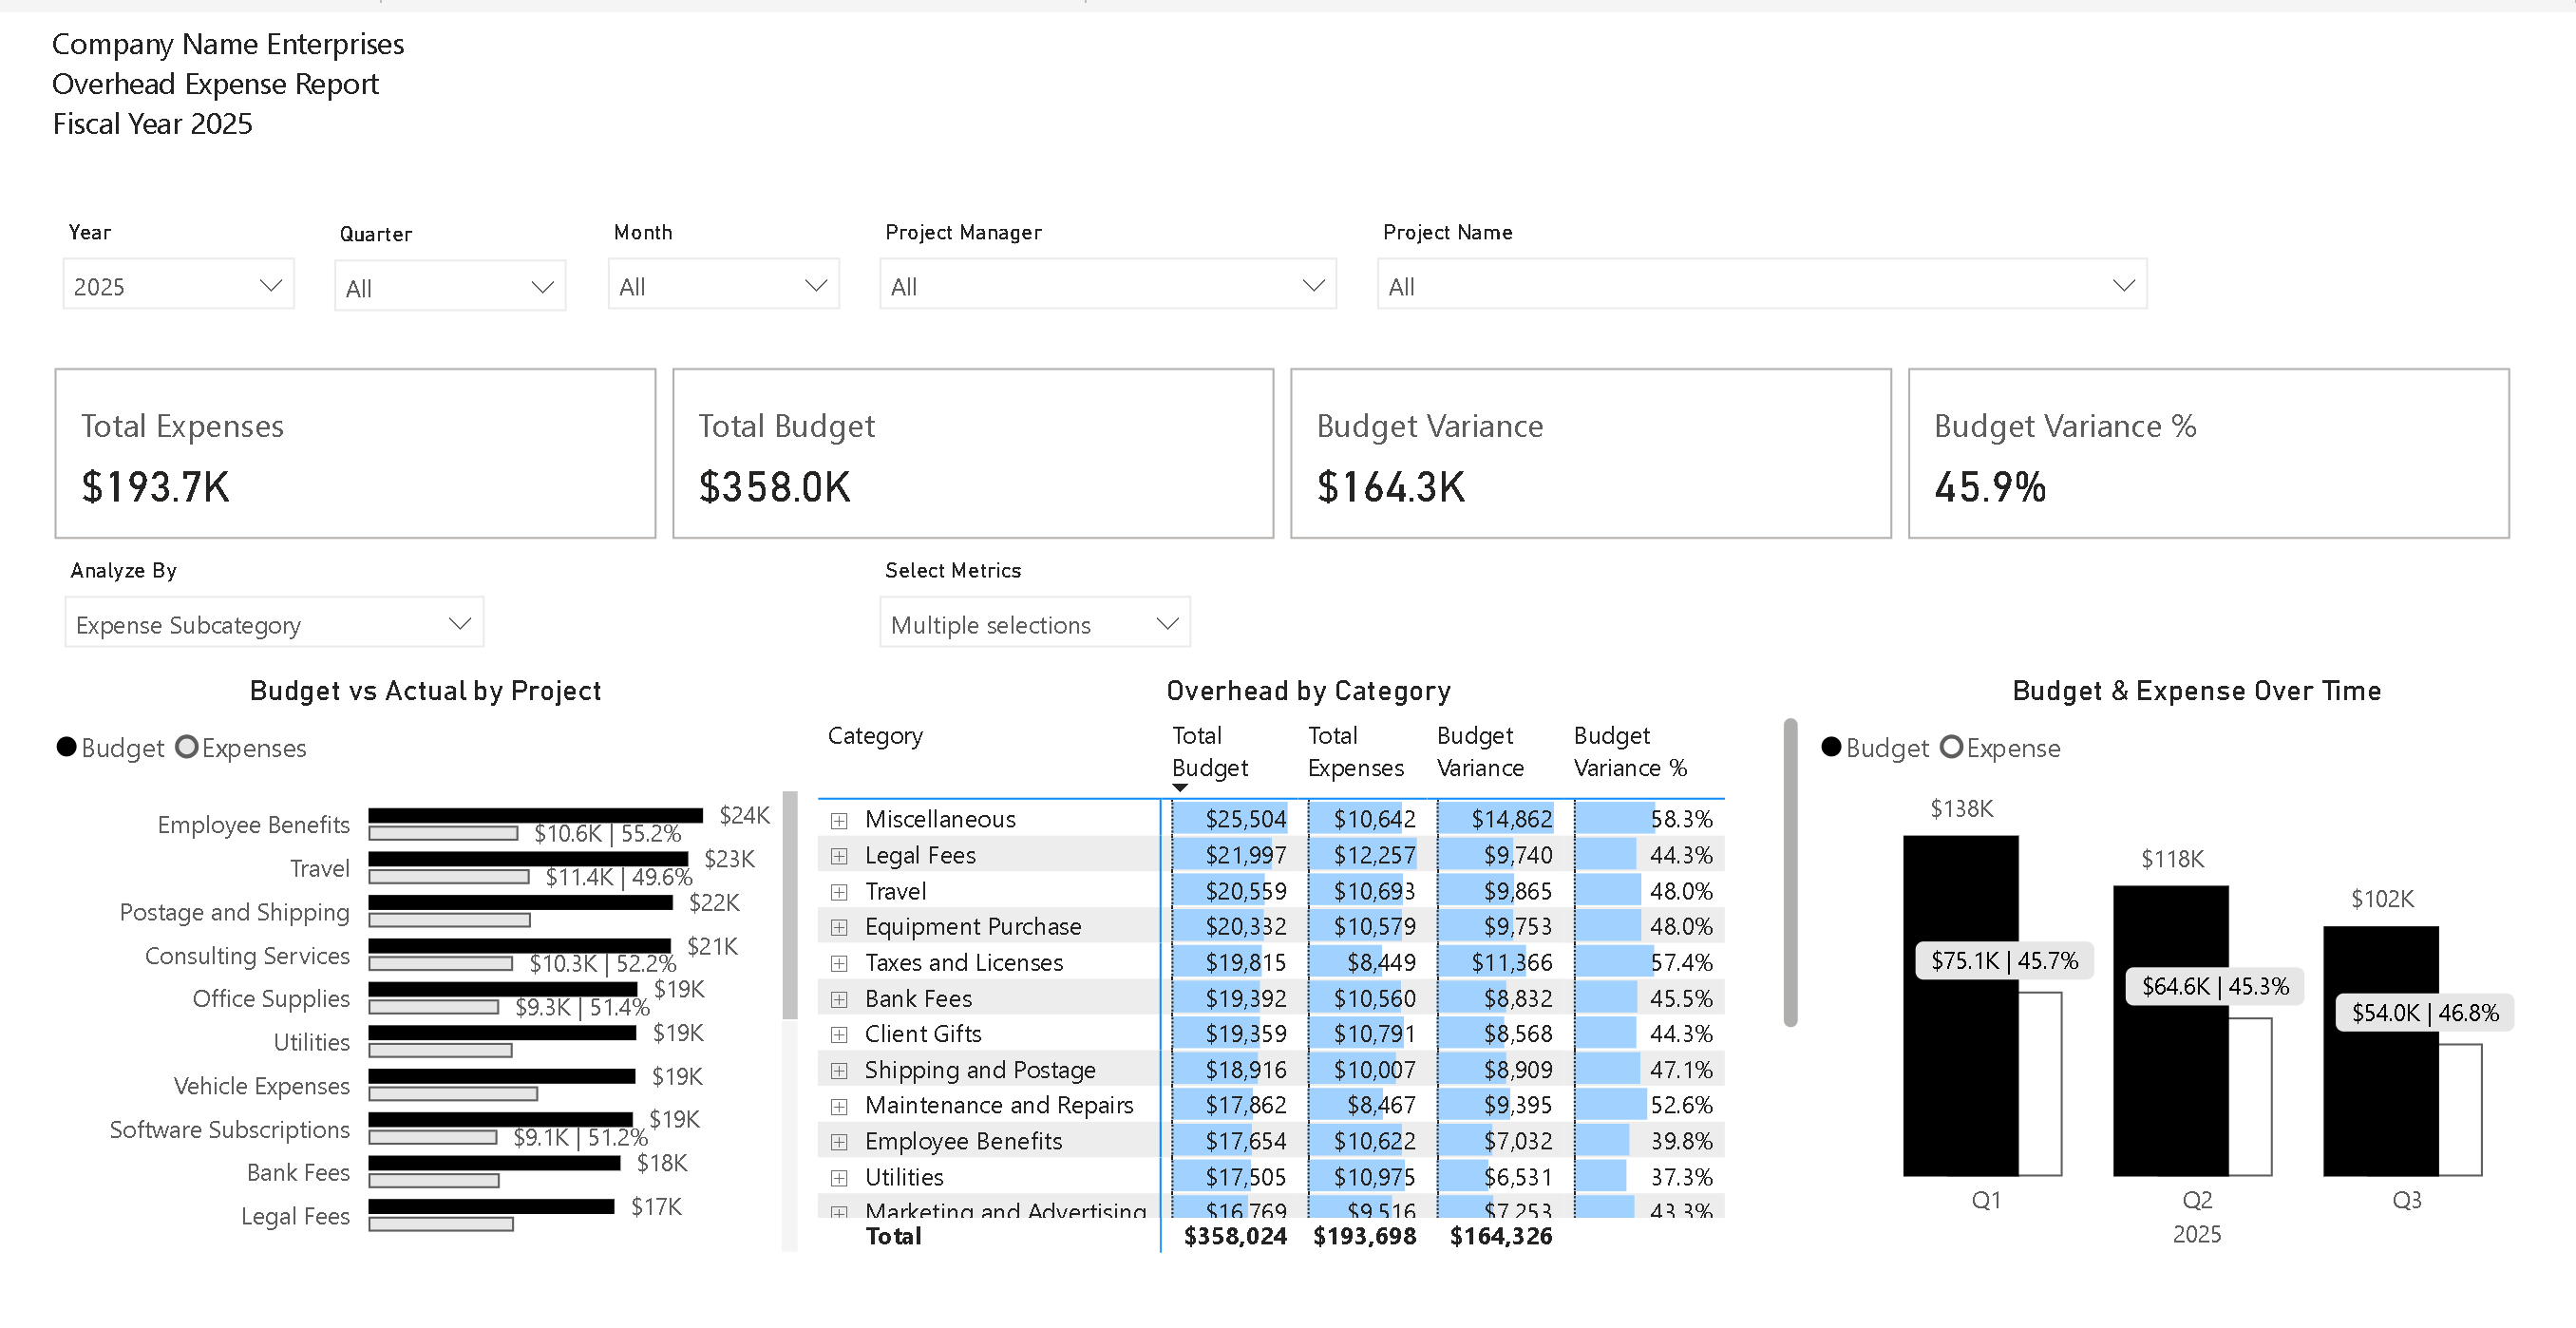
The Challenge: Project-based businesses often struggle to track expenses across multiple
projects, managers, and cost categories. Relying on static spreadsheets leads to out-of-date
information, making it nearly impossible to identify budget overruns before they impact the
bottom line.
The Solution:
I developed a comprehensive, one-page Power BI dashboard to provide a single source of truth for
project financials. The report features advanced interactivity, including dynamic parameters
that allow users to instantly change chart dimensions (e.g., "Analyze By" Project or Expense
Category) and toggle the metrics displayed in the detailed matrix with a single click.
The Impact:
This dashboard replaces hours of manual reporting with an on-demand, holistic view of budget vs.
actual spending. It empowers executives and project managers to instantly spot trends, identify
areas of overspending, and make proactive, data-driven decisions that protect profitability.
Key Features:
- ✓ Dynamic KPIs (Total Expenses, Budget, Variance)
- ✓ Interactive Slicers for Time & Project Hierarchy
- ✓ Parameter-driven visuals for flexible analysis
- ✓ Trend analysis and detailed drill-down matrix